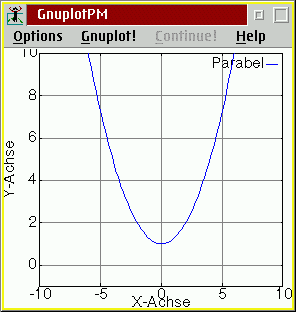
There are two windows: a textual window with a command line and a graphical window for the output. The syntax of the formula is nearly the same as 4allCalc, the main difference is the power of sign (4allCalc ^ GnuPlot **). You can also write text files with commands comparible to batch files:
#this is a comment
set grid
#set output "function.plt"
#set terminal hpgl
set ylabel 'Y-Axis'
set xlabel 'X-Axis'
set label 'a Parable' at 50,50
plot [] [-1:10] 0.25*x**2 + 1 title 'Parabel' with lines
pause -1

Instead of the formula, you also can write a filename of a text file containing two columns of numbers, divided by a space; you also can draw several graphs at once:
plot [] [] 'data1.lst' title "graph of data list 1" with lines,\
'data2.lst' title 'graph of data list 2' with lines
Here you can download GNUPLT35.ZIP for OS/2 (size 390 k),
Gnuplot Win32 (349 k) or Gnuplot Win16
.